by Olivia Williams, PhD Candidate at American University with Benjamin Stokes
To guide our evolving design for the DC Storytelling System, we wanted a “snapshot” of how stories already circulate. I focused on one neighborhood (Woodridge), and mapped the flow of civic stories. My goal was to look across organizations and media channels using a powerful framework from urban sociology.
OUR SUSPICION: Neighborhood leaders struggle to connect their face-to-face organizing with their online organizing to circulate local stories. If successful, our design intervention will significantly increase the impact of neighborhood stories on group cohesion by fitting to the ecosystem currently connecting groups and residents.
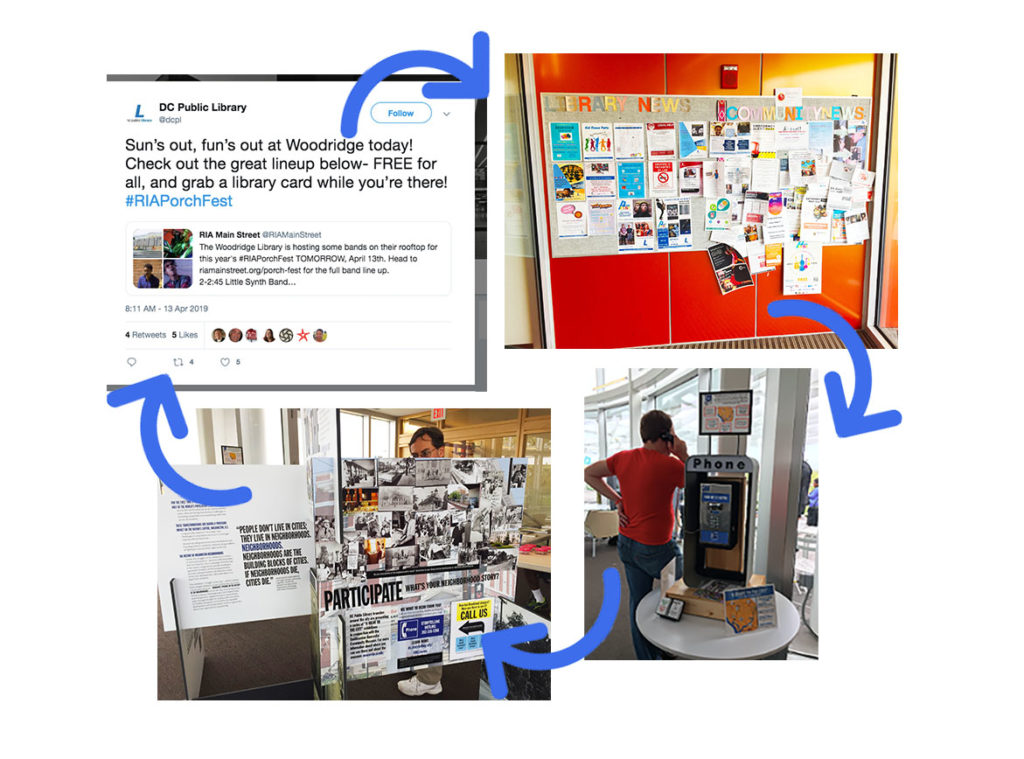
Clockwise from top left: Tweet from DC Public Library about PorchFest, a local event taking place in the Woodridge Neighborhood; Woodridge Neighborhood Library bulletin board (credit: Olivia Williams); our and Smithsonian’s payphone storytelling system in the library for PorchFest (credit: Benjamin Stokes) and a free-standing local history exhibit inside Woodridge Neighborhood Library (credit: Olivia Williams).
We know that some stories are repeated again and again — for better and worse — but not others. Can we help neighborhoods to pick the stories that will be most useful to retain local culture, or boost the capacity for collective action? Research on local networks can help to reveal how some stories might reach all corners of a network, while others are siloed or fail to gain traction. We began by talking with residents casually, asking: How are local stories shared? Are they shared seamlessly or are there gaps? What kind of physical and digital spaces are being used to share local stories? Do physical and digital spaces merge to encourage the telling of local stories?
Circulating stories can have a real impact, including for economic outcomes. Many people think stories are just part of culture. However, gentrification rates are affected by local perceptions of a neighborhood (i.e., story circulation) according to sociologists like Robert Sampson and Jackelyn Hwang.
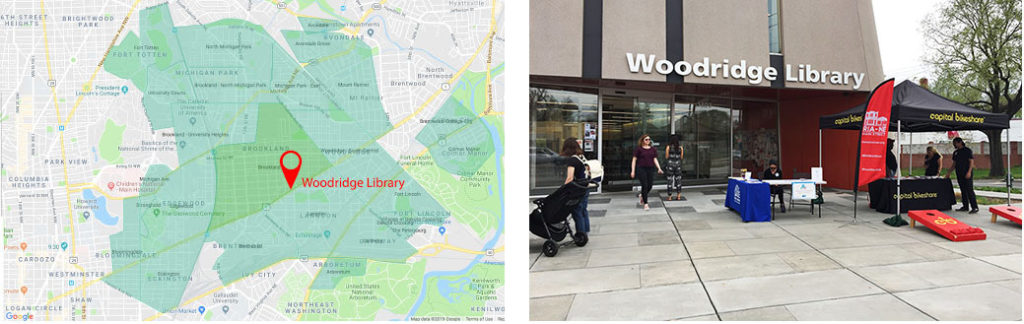
Left to right: map of Woodridge as indicated on the Nextdoor Brookland webpage and exterior of Woodridge Neighborhood Library (credit: Olivia Williams)
Here is a visual way to make sense of Woodridge storytelling, using the three categories of Communication Infrastructure Theory (CIT). Note that this is a partial list of storytellers, and more will be added as we map the network more completely.
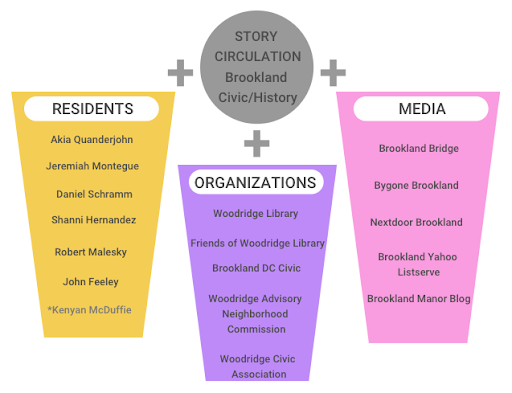
(If you are a Woodridge resident, we would love to hear from you about this visual: do you see something missing? Please let us know. This iterative research grows stronger as we share this diagram with locals and gather feedback. )
We map the network in terms of three nodes or perspectives, since we know that neighborhoods can only tell their own story if they have three connected things: (1) residents with direct experience of the neighborhood who tell bottom-up stories, (2) local organizations that select key stories for campaigns in the public interest, including a shared sense of history and place; and (3) local media that amplify and broadcast stories to larger audiences. This approach comes from decades of research into the sociology of neighborhood storytelling networks, conducted initially in Los Angeles by the Metamorphosis Project. Their findings have been published to describe neighborhood storytelling networks, including as Communication Infrastructure Theory (CIT).
Visually, we can can picture neighborhood networks in very different ways. For example, we can emphasize the large nodes as coherent blocks (at left in Figure 4), or as colored types for every local actor (at right).
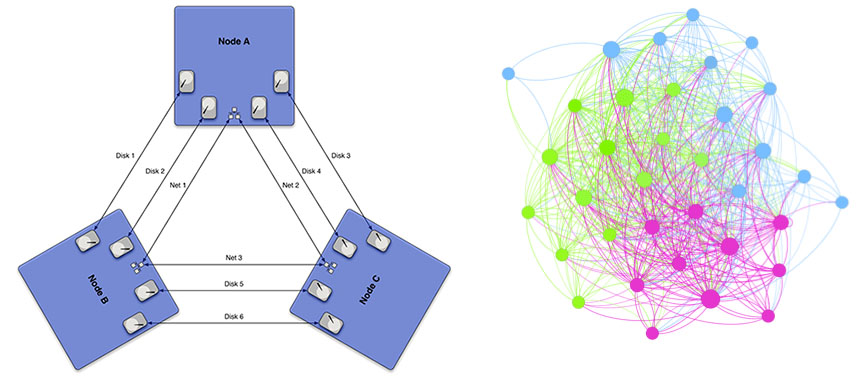
For mapping projects, we often start with the block approach first to see if the neighborhood is missing any of the major types of storytellers, such as a lack of local news media. Yet residents often find it easier to discuss the maps at right, and give feedback on the validity of the approach.
How do the digital and physical connect? We find that each of the different nodes use a mixture of physical and digital — but in very different ways.
Some early observations include:
- Stories are being shared in many ways: word of mouth, retweeted, re-posted, uploaded, re-uploaded, downloaded across all sorts of platforms: blogs; social media platforms like Twitter, Facebook, Instagram, YouTube; listservs and a range of resident-managed websites.
- Some of the stories were picked up by statewide or national media agencies and used to reinforce the brand or perception of the community to the outside world.
- We might call the sum of the network (across all three types of node) as “civic circuitry” for local storytelling, including to circulate and amplify local stories. The metaphor of circuitry is a more digital-friendly term that parallels what the Metamorphosis Project called “communication infrastructure” (which has a decidedly more physical ring to it). We are investigating how the presence of a healthy network helps communities to retain their identity and keep stories of civic history alive. These stories may not be “news”, but they focus attention and shape the local narratives about what matters to the community; in other words, they help set the agenda for local discussion (we call this ‘agenda setting’ in communication research).
These observations have led us to asking a series of additional questions:
- Is this network ‘healthy’? (How would residents answer this question?)
- Is anything hindering the network?
- What connections could make the flow of stories stronger? (How would local organizations address this?)
- How should our design best respond to the network analysis, including where should we position our installation in physical space and in online flows of discourse?
…We will pursue these questions in coming weeks, now that we have the beginnings of a network model.